
Sales Pipeline and Forecasting for Telecoms Resellers
Review the services and commercial assumptions behind each opportunity, from the first discussion through to the billing handover.
A pipeline built around the reseller’s sales process
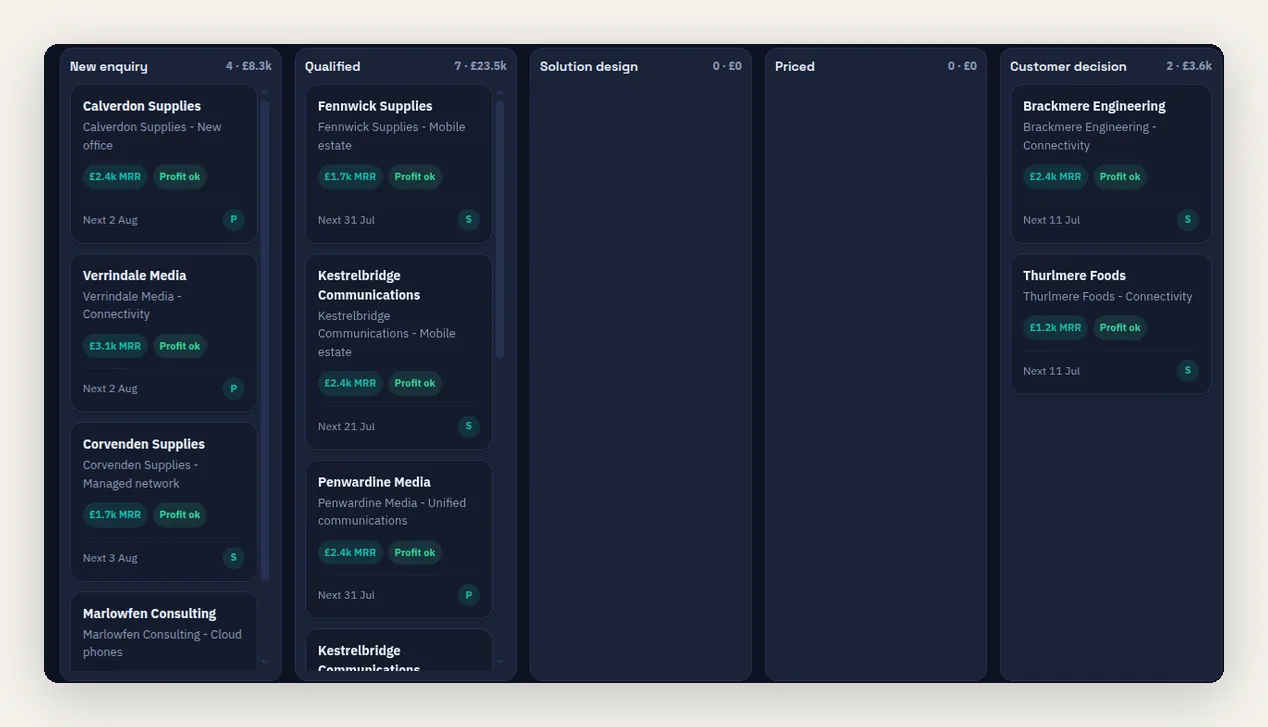
Configure stages to reflect the evidence your team needs before an opportunity progresses. Deals retain customer context, activities and proposed products, so a review can move from the headline value to the services and next action.
The board helps organise open work by stage. Where enabled, separate pipelines can support different processes such as new business and renewals. A stage should indicate real progress rather than simply the age of the opportunity.
A forecast with a traceable pricing basis
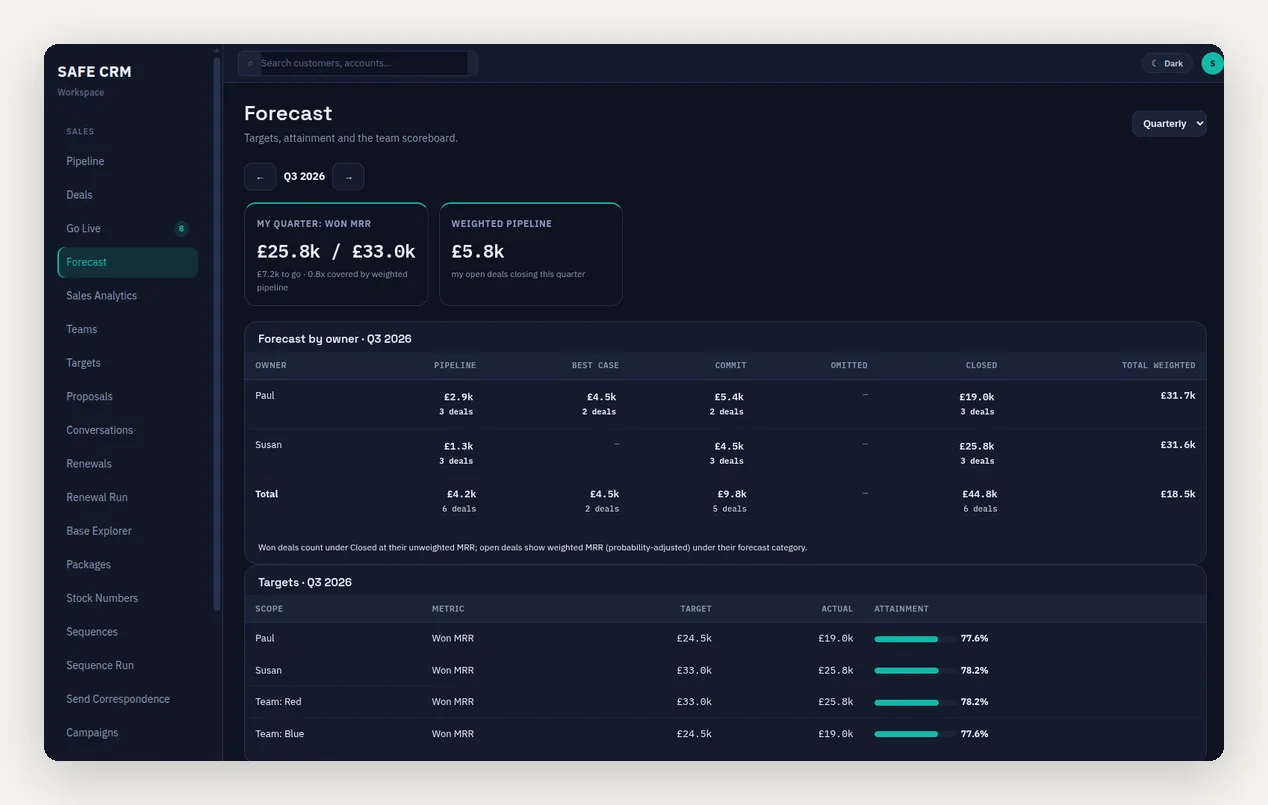
Recurring and one-off values come from the products on the deal and the platform’s pricing information. Forecast views can weight open opportunities and show categories, owners and target attainment for a selected period.
Expected usage is distinct from committed service charges. Recorded confidence categories identify whether an estimate comes from a verified bill, customer estimate, historical usage or an assumption, giving reviewers a clear basis for follow-up.
Review margin, options and delivery assumptions
Supplier costs and profit information are available where recorded and permitted. Pricing warnings and forecast nudges help identify work to review, including expired close dates, inactivity and probability differences.
Only the primary deal represents a mutually exclusive alternative group in the weighted forecast. The expected close date still describes a sales decision; it does not establish when a circuit or hosted service will be activated.
Measure progress and retained business
Targets can cover a month or quarter and an individual, department, team or wider business scope. Measures include won recurring value, one-off value, deal count and weighted pipeline.
Analytics use recorded stage history to show the funnel and time spent in stages, alongside win rates and median cycle length. Renewal outcomes need separate interpretation: preserving existing recurring revenue is different from adding new revenue.
Hand accepted work into billing
Accepted products pass through the go-live workflow, where authorised staff review the activation details. A renewal must link to the correct existing record so that the agreed change does not create a duplicate service charge.
Forecasting and targets sit within the Growth feature set; related capabilities such as alternative deals and multiple pipelines require the relevant higher-tier access. See CRM pricing for the current structure.
Related CRM workflows
Questions about sales pipeline and forecasting for telecoms resellers
Are deal values entered as a single estimate?
Do alternative proposals inflate the forecast?
Does a won deal start billing immediately?
Is sales cycle length an average?
Review a Reseller Opportunity
Follow a voice or connectivity opportunity through pricing, the forecast and the handover for activation.